
San Francisco Real Estate Prices and Sales Continue to Drop
San Francisco median sales price for single-family, re-sale was down 10.2% in November from October. It was down 20.6% year-over-year.
The average sales price for single-family, re-sale homes was down 8.7% month-over-month. Year-over-year, it was down 18.1%.
Sales of single-family, re-sale homes fell 36.7% year-over-year. Sales were down 2.7% from October. There were 179 homes sold in San Francisco last month. The average since 2000 is 214
The median sales price for San Francisco condos was down 9.4% year-over-year.
The average sales price was down 3.2% year-over-year.
Sales of condos in San Francisco fell 88.3% year-over-year. There were 167 condos/lofts sold last month. The average since 2000 is 230.
The sales price to list price ratio, or what buyers are paying over what sellers are asking, fell from 104.4% to 102.3% for homes. The ratio for condos/townhomes fell from 99.9% to 98.6%.
Average days on market, or the time from when a property is listed to when it goes into contract, was 34 for homes and 51 for condos/lofts.
Momentum Statistics
Sales momentum…
for homes dropped 6.4 points to –26.4. Sales momentum for condos/lofts was down 11.7 points to –37.9.
Pricing momentum…
for single-family homes fell 2.8 points to –0.7. Pricing momentum for condos/lofts fell 0.9 of a point to –0.6.
Our momentum statistics are based on 12-month moving averages to eliminate monthly and seasonal variations.
If you are planning on selling your property, call me for a free comparative market analysis.
We calculate…
momentum by using a 12-month moving average to eliminate seasonality. By comparing this year's 12-month moving average to last year's, we get a percentage showing market momentum.
In the chart below…
the blue area shows momentum for home sales while the red line shows momentum for pending sales of single-family, re-sale homes. The purple line shows momentum for the average price.
As you can see, pricing momentum has an inverse relationship to sales momentum.

The graph below shows the median and average prices plus unit sales for homes.

Remember, the real estate market is a matter of neighborhoods and houses. No two are the same. For complete information on a particular neighborhood or property, call me at 415.336.9695


The graph below shows the median and average prices plus unit sales for condos/lofts.
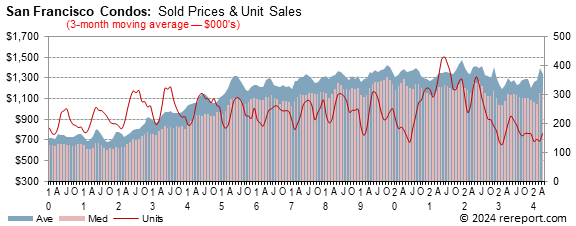
The real estate market is very hard to generalize. It is a market made up of many micro markets. For complete information on a particular neighborhood or property, call me.
If I can help you devise a strategy, call or click the buying or selling link in the menu to the left.
Enough For The Fed?
Over the last several months, investors have been searching for signs of the kinds of economic slowness and tempering in inflation that would give the Fed reason to slow the size or pace of rate hikes. While there have been some mixed signals over the last month or two, the open question is whether there are enough to date to see the Fed comfortable with a smaller increase at the next FOMC meeting.
That get-together is only a few days away at this point, and the answer to the question of "75 basis point or 50 basis points" in increase still isn't quite clear. In recent weeks, investors have more strongly leaned toward 50 basis points, a consensus supported by some improvement -- or at least a leveling off -- of inflation pressures in recent months. The Fed's preferred measure of price tracking (the core Personal Consumption Expenditure (PCE) measure) had been as high as an annualized 5.3% in February, meandered its way down to an improved 4.7% by July, but then re-firmed to 5.2% in September. The latest report covering October showed a slight cooling again, back to a 5% rate. While steadying inflation is a good sign, there has been little measurable or sustained progress toward lower inflation to be seen so far
So inflation is somewhat better but still not good.
Outlays for construction projects declined by 0.3% in October. That's not a big surprise given that residential construction is the largest component and has been in a funk for months now. Spending on residential projects fell by 0.3%, a fifth consecutive decline, and spending for non-residential projects also dipped by 0.8%, although this came after a five-month string of increases. Public works spending helped keep the overall number from declining further, rising by 0.6% in October, making it five increases in a row.
As anyone who follows mortgage or real estate markets can tell you, housing markets have been crushed this year by mortgage rates that more than doubled since last December. Already-slow sales of existing homes are poised to slow even further, according to the Pending Home Sales Index from the National Association of Realtors. This measure of signed contracts foretells home sales a month or two into the future; October's PHSI rang in at just 77.1 -- a figure that matches an all-time low (20+ years, and excluding the pandemic hard-stop months in early 2020). As well, not all contracts signed turn into closings, but the 4.6% decline in contracts executed in October already suggests that sales in the next month or two are likely to come in lower than the 4.43 million (annualized) rate recorded for October. We'll need to wait until late December for November's sales, and it'll be nearly February before we learn what happened in December... and all that before the seasonal slowdown for home sales typically seen in January and into February impact the market, too.
Requests for mortgage credit shrank by 0.8% in the week ending November 25, but since that was a holiday week, it's hard to get a clean reading on activity. That said, applications for purchase-money mortgages rose by 3.8%, a third week of gains as potential homebuyers look to take advantage of the recent decline in mortgage rates. Homeowners, seemingly had better things to do than to consider refinancing at these rate levels, and refinance application dropped 12.9% for the week.
Mortgage rates have been somewhat lower in recent weeks as the chances for a less-aggressive Fed have grown. That mini-trend seems likely to be in place for at least the early part of next week, and odds favor that we'll see another small decline in the average offered rate for a conforming 30-year fixed-rate mortgage as reported by Freddie Mac next Thursday at noon. We'd reckon the expected decline to be a handful of basis points, probably five or so.