San Francisco Home Prices & Sales Up in April
The median sales price for single-family, re-sale rose 2.9% in April from March. It was up 13.1% year-over-year.
The average sales price for single-family, re-sale homes was up 10.2% month-over-month. Year-over-year, it was up 11.5%.
Sales of single-family, re-sale homes rose 27.9% year-over-year. There were 211 homes sold in San Francisco last month. The average since 2000 is 214.
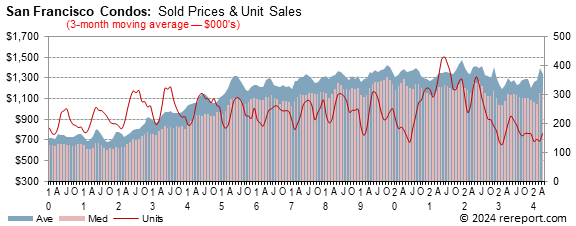
The median sales price for condos/lofts was down 7.9% year-over-year.
The average sales price was down 8.5% year-over-year.
Sales of condos/lofts fell 10% year-over-year. There were 189 condos/lofts sold last month. The average since 2000 is 230.
The sales price to list price ratio, or what buyers are paying over what sellers are asking, rose from 107.4% to 107.5% for homes. The ratio for condos/townhomes fell from 100.9% to 100.7%.
Average days on market, or the time from when a property is listed to when it goes into contract, was 22 for homes and 57 for condos/lofts.
Momentum Statistics
Sales momentum…
for homes rose from –14.9 to –7.9. Sales momentum for condos/lofts was down 6.4 points to –26.
Pricing momentum…
for single-family homes rose 3.7 points to –2.7. Pricing momentum for condos/lofts rose 0.5 of a point to –1.5.
Our momentum statistics are based on 12-month moving averages to eliminate monthly and seasonal variations.
If you are planning on selling your property, call me for a free comparative market analysis.
We calculate…
momentum by using a 12-month moving average to eliminate seasonality. By comparing this year's 12-month moving average to last year's, we get a percentage showing market momentum.
In the chart below…
the blue area shows momentum for home sales while the red line shows momentum for pending sales of single-family, re-sale homes. The purple line shows momentum for the average price.
As you can see, pricing momentum has an inverse relationship to sales momentum.

The graph below shows the median and average prices plus unit sales for homes.

Remember, the real estate market is a matter of neighborhoods and houses. No two are the same. For complete information on a particular neighborhood or property, call me at 415.336.9695


The graph below shows the median and average prices plus unit sales for condos/lofts.
Marin Home Prices & Sales Up
| |||||||||||||||||||||||||||||||||||||||||||||||||||||||||||||||||||||||||||||||||||||||||||||||||||||||||||||||||||||||||||||||||||||||

The real estate market is very hard to generalize. It is a market made up of many micro markets. For complete information on a particular neighborhood or property, call me at 415.336.9695
If I can help you devise a strategy, call or click the buying or selling link in the menu to the left.